Token activity and profit and loss
The Token tab traces one wallet's history in the token the current page (or the audit token picker) is following, then turns that history into a profit-and-loss breakdown and an activity feed.
What you'll see
Tracing
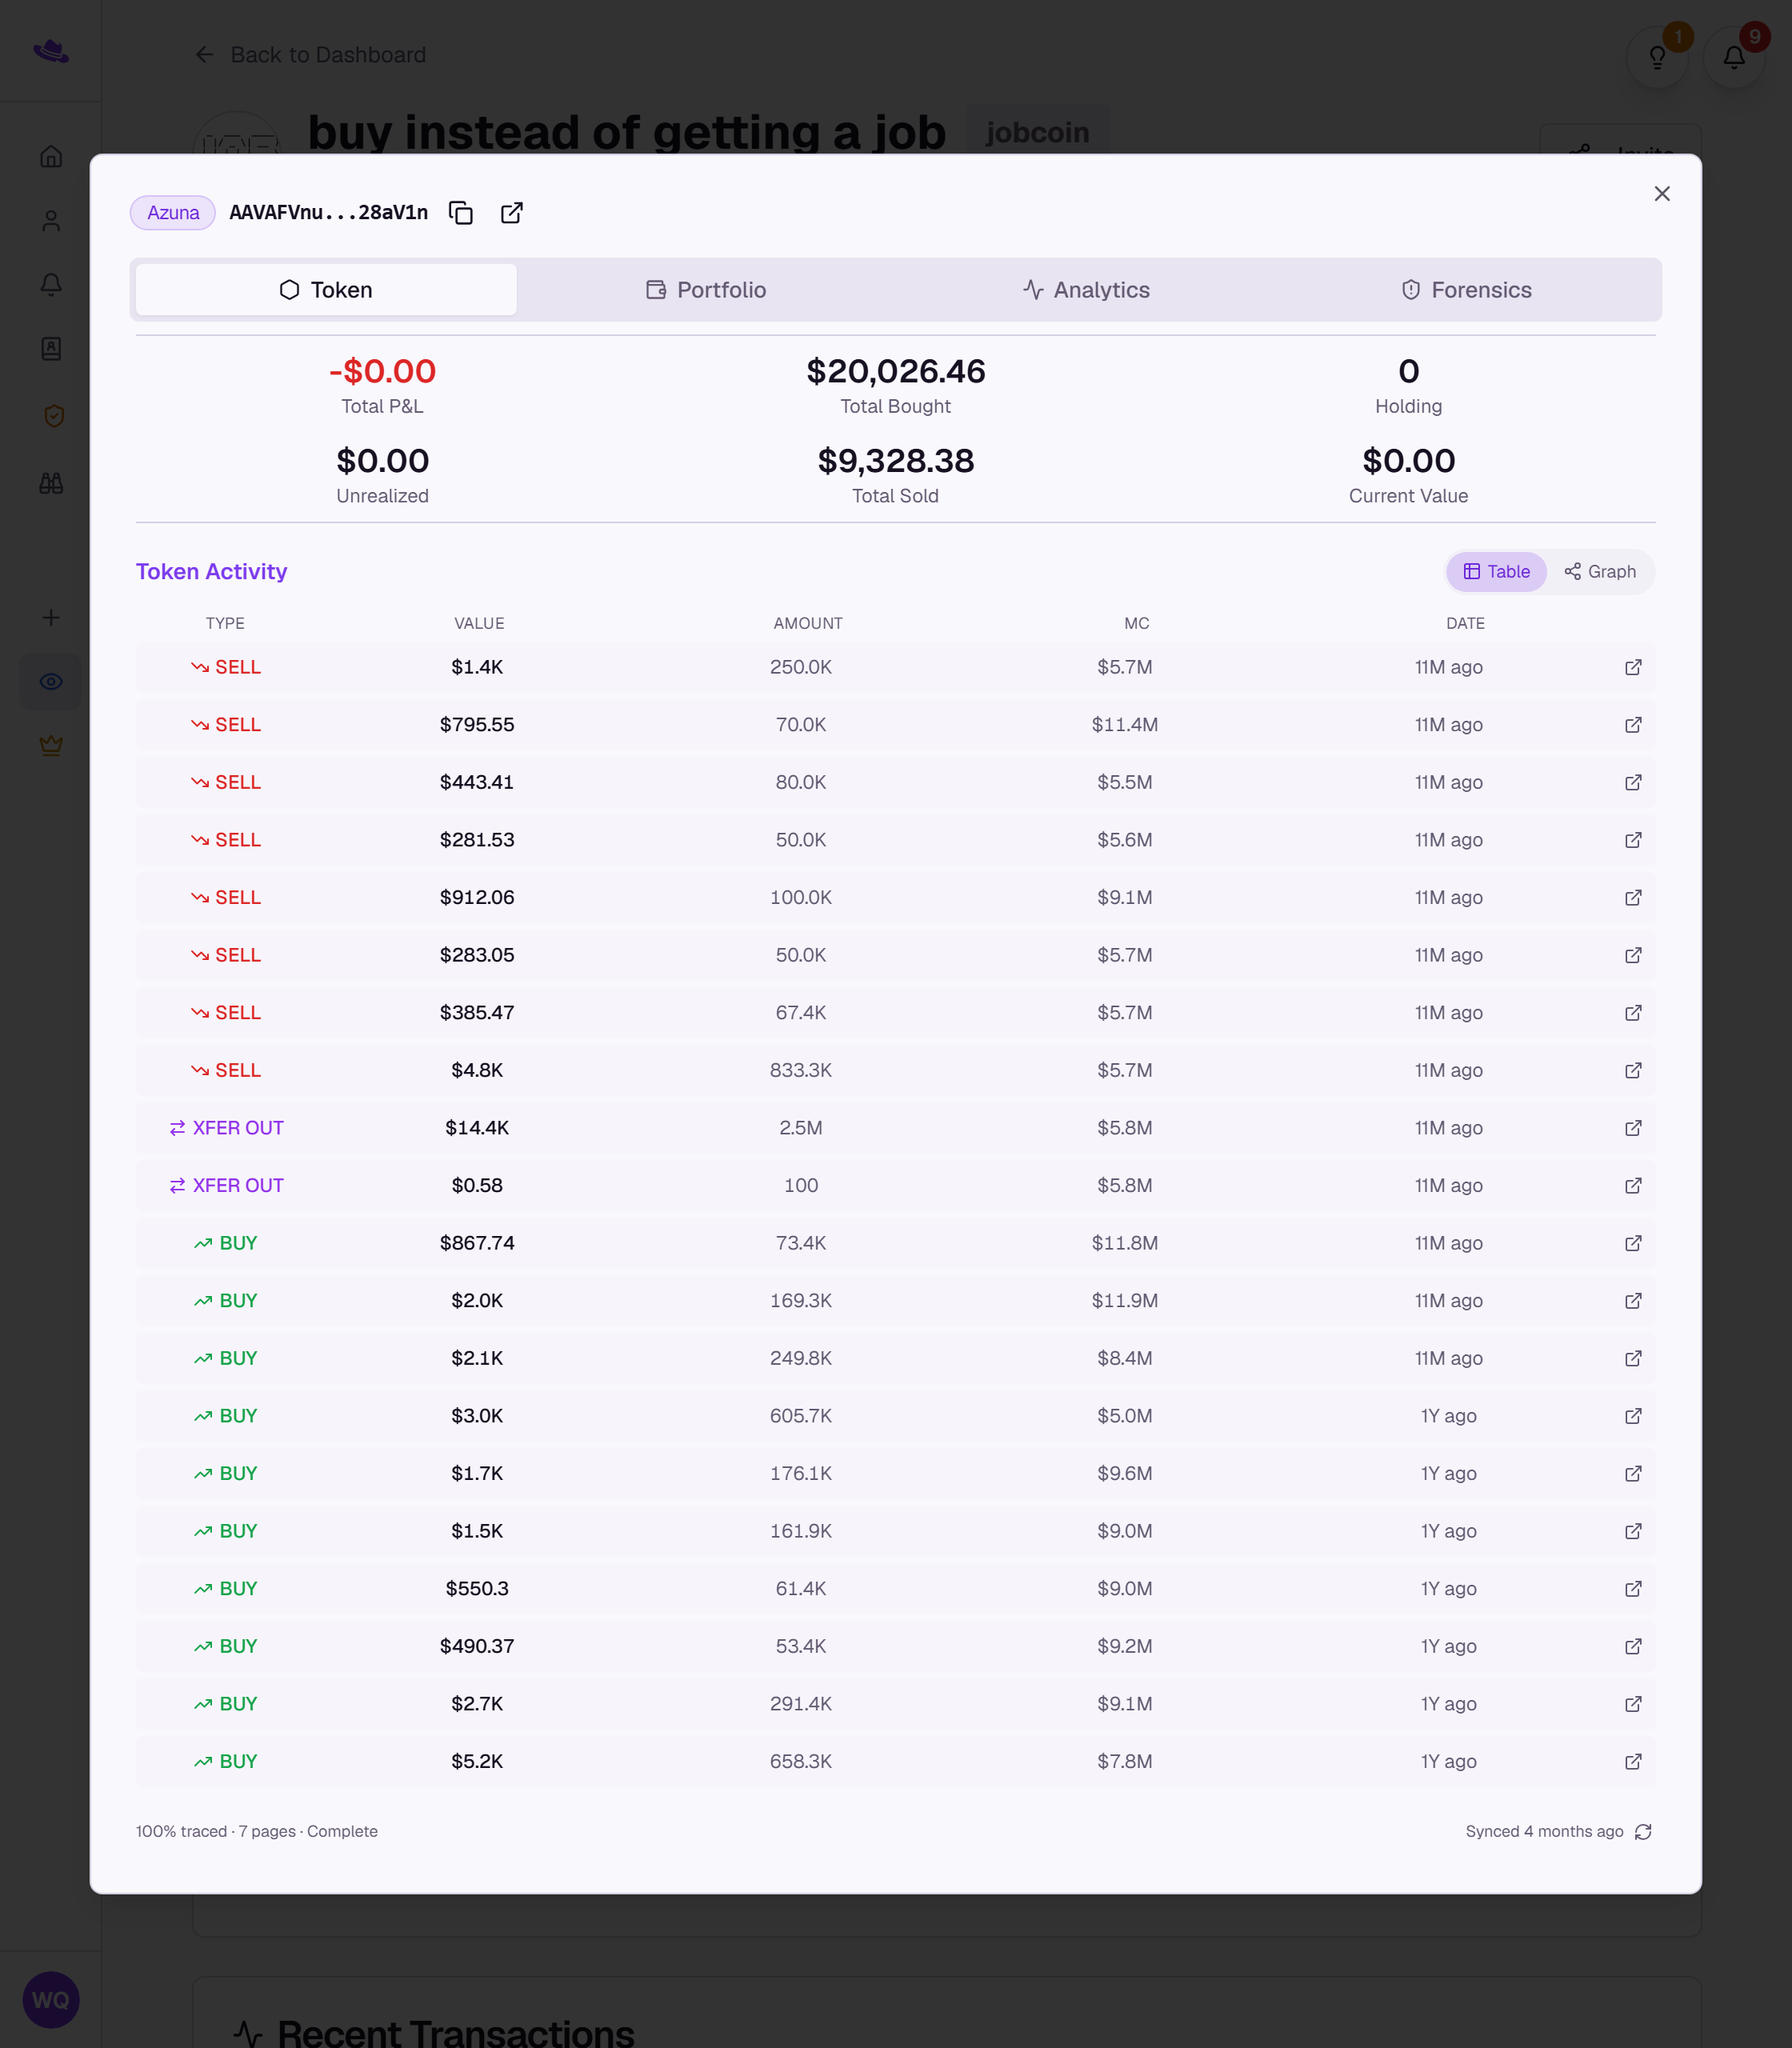
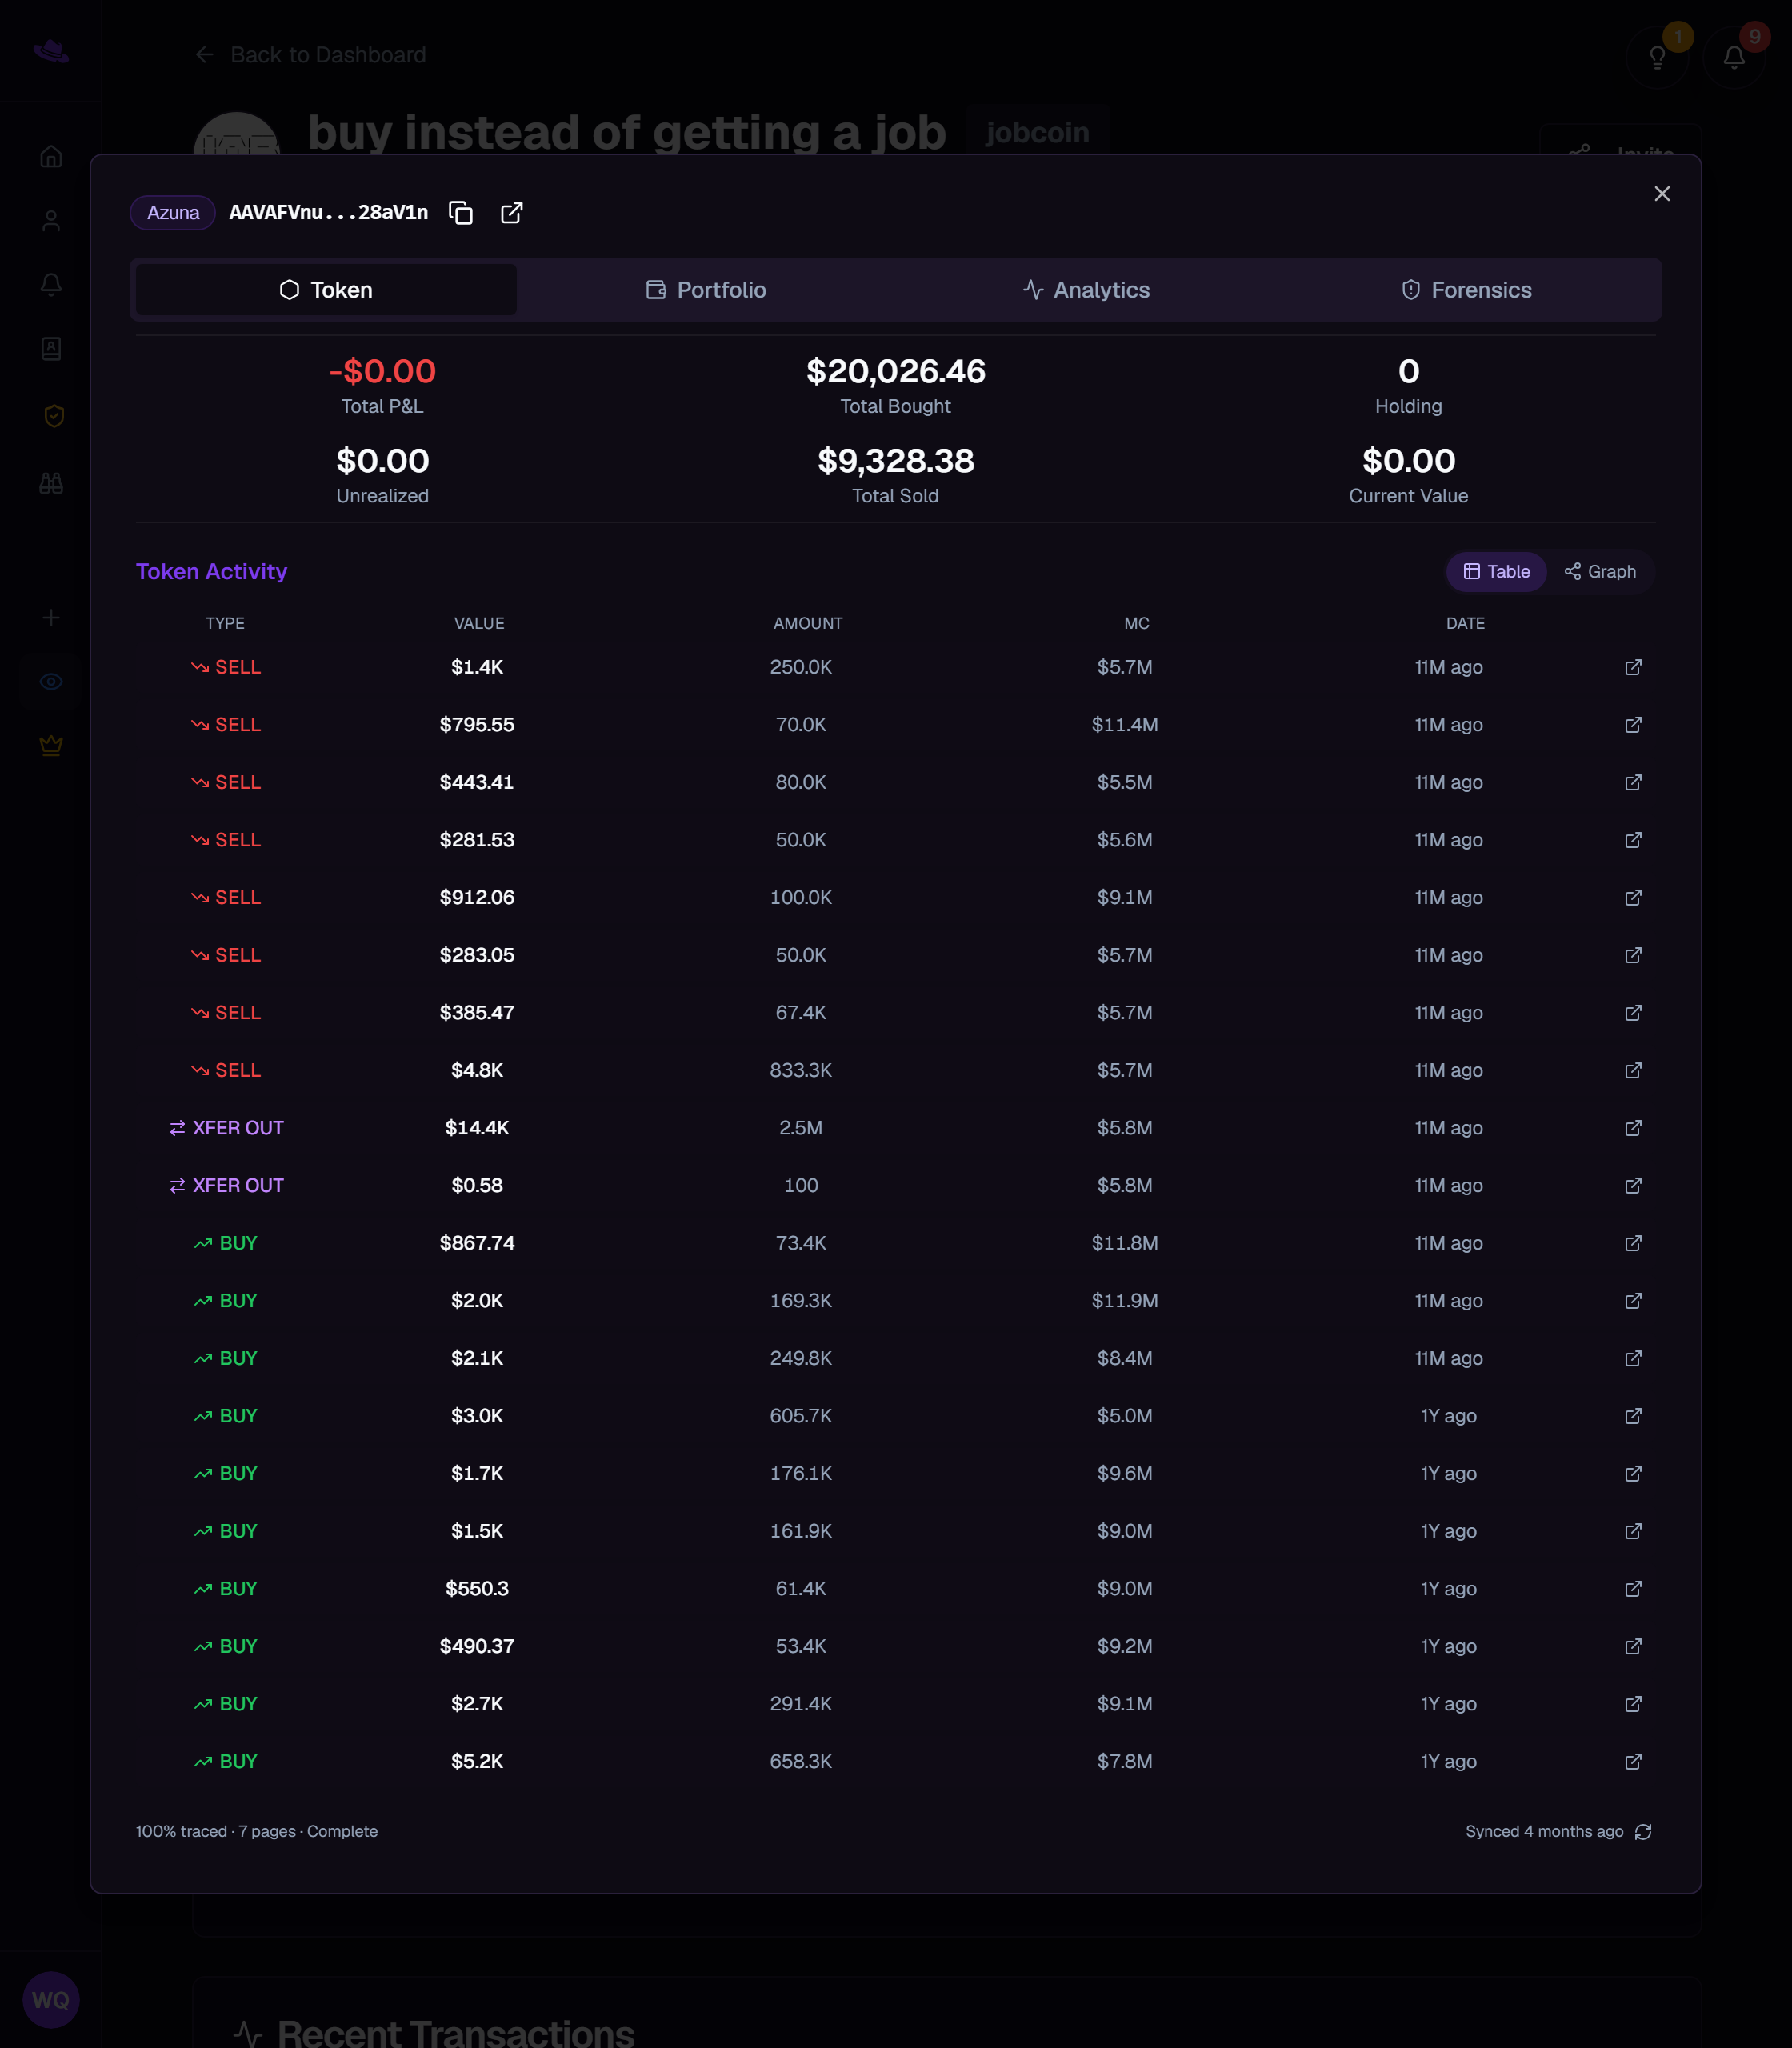
Wallet Sleuth traces automatically the first time you open a wallet's Token tab. A progress bar shows how much of its history has been traced so far; while it's incomplete, a banner marks the profit-and-loss figures as approximate. Trace history (or Trace deeper once the first pass is done) and Trace 5 pages pull further back, each spending from your trace allowance; see pricing for what your plan includes. A small refresh icon beside the last-synced time pulls in only new activity since the last trace, at no extra cost.
Profit and loss
Once there's enough traced history, six figures summarize the wallet's position in this token: Total P&L, Total Bought, Holding, Unrealized, Total Sold, and Current Value. These are computed with a moving-average cost basis; see Profit and loss for exactly how buys, sells, and the wallet's live balance feed into them.
Token Activity
Below the figures, Token Activity lists every traced buy, sell, and transfer, each with its value, amount, an implied market cap at the time, and when it happened. Switch Table to Graph to see the same activity as a flow diagram instead, which also lets you follow a connected wallet: select one of its nodes to open that wallet's own profile in place, with a back arrow in the header to return.